
Monthly observations · saved research edition
September 2026 software payment and spend research
A recorded view of software purchasing through Cledara. This edition retains its original values, source publications and downloadable charts.
Observations: September 2026 · Edition r1 · Published .
Edition identifier
24605c19258e16cbb18f78e289729543f939c115f6d08e50c6153e31103b4423Key findings
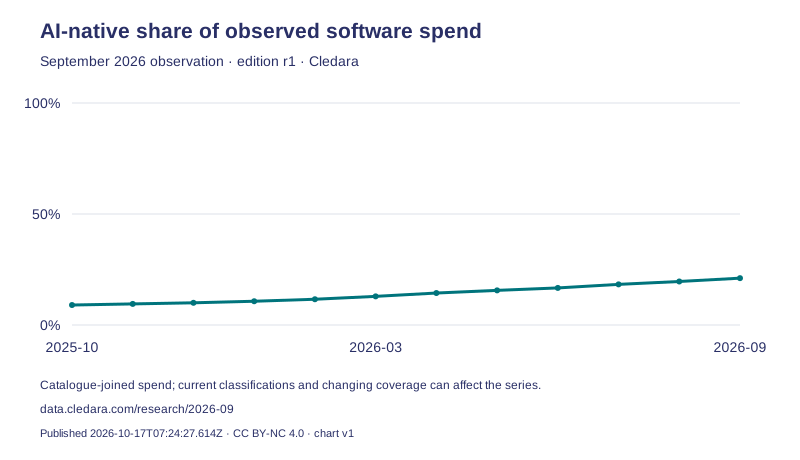
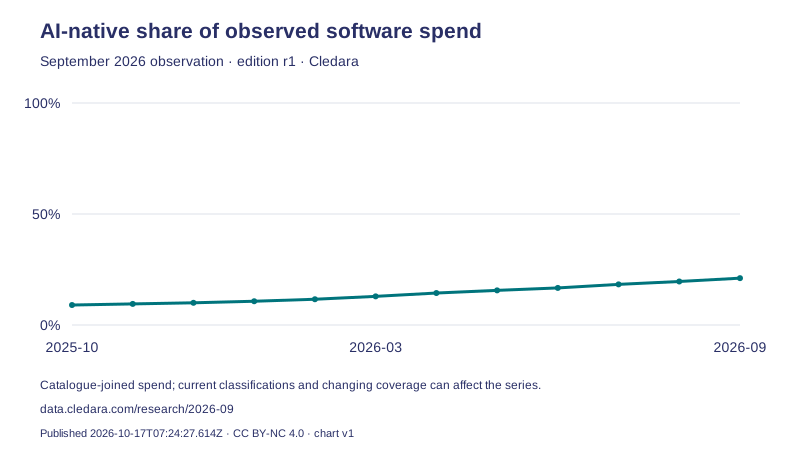
- AI-native products represent 21.1% of catalogue-joined observed software spend at the September 2026 observation. This is 1.5 percentage points above the preceding calendar month.
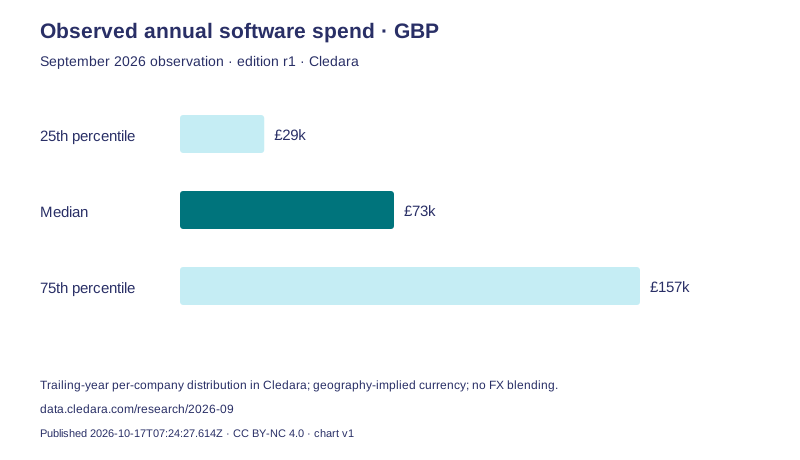
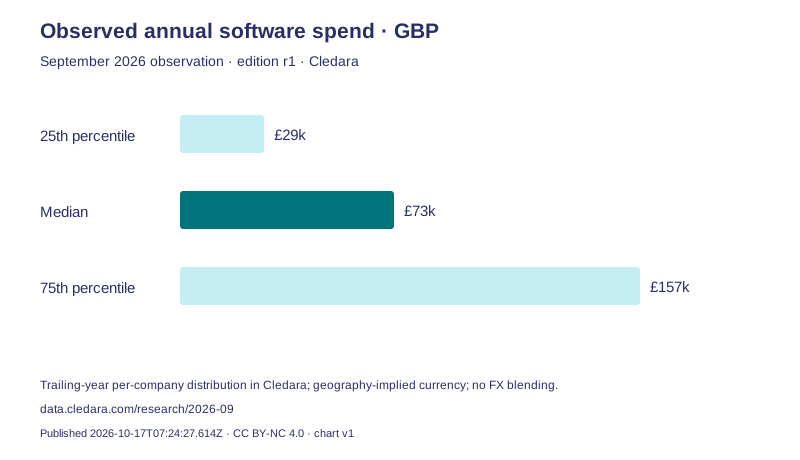
- Median observed trailing-year software subscription spend is £73k per eligible company in the GBP slice through September 2026. The middle half spans £29k–£157k. This is an aggregate distribution within Cledara, not a vendor price or an annualized monthly estimate.
Software payments managed through Cledara. The customer population, recorded products and classifications can change; these observations are not a representative survey of all businesses, active product usage or national market share.
Unavailable in this edition
- AI product leaders have no validated matching observation month for this edition.
AI-native share of observed software spend
AI-native spend share divides the spend shares of currently AI-native-classified products by the spend shares represented in the catalogue-joined product metrics at each named monthly observation. Classifications and coverage can change. It is not a measure of seats or product usage.
| Observation | Spend share |
|---|---|
| 2025-10 | 9.0% |
| 2025-11 | 9.5% |
| 2025-12 | 10.0% |
| 2026-01 | 10.7% |
| 2026-02 | 11.6% |
| 2026-03 | 12.9% |
| 2026-04 | 14.4% |
| 2026-05 | 15.6% |
| 2026-06 | 16.7% |
| 2026-07 | 18.3% |
| 2026-08 | 19.6% |
| 2026-09 | 21.1% |
Observed trailing-year software subscription spend
Per-currency aggregate median and 25th/75th percentiles of observed trailing 12-month per-company software subscription spend. Currency is inferred from buyer geography; currencies are not blended or FX-converted. The cohort can change and new companies may have less than a full year of observed payments. Amounts follow the source cleaned-payment basis; missing refund or reversal status can affect totals. Source publication floors apply; absolute buyer counts are withheld.
GBP spend slice
| Statistic | Amount |
|---|---|
| 25th percentile | £29k |
| Median | £73k |
| 75th percentile | £157k |
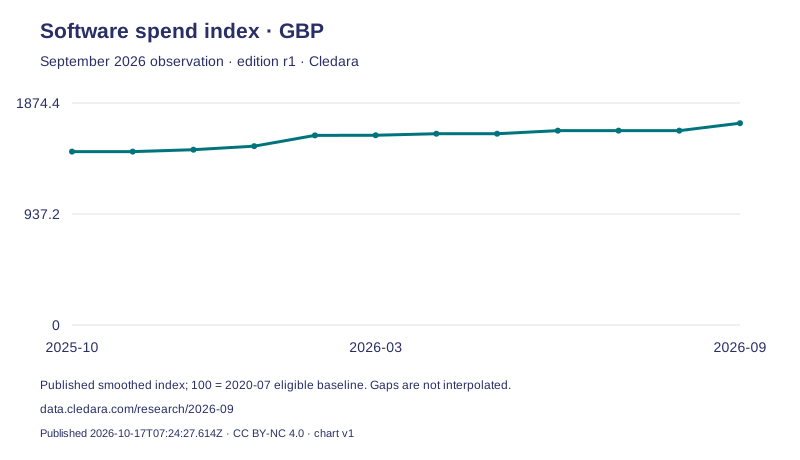
Index baseline: 2020-07; 100 represents the recorded eligible baseline. Gaps are not interpolated. Methodology fingerprint: 2026-10-known-buyers+usable-spend+coverage-90pct+rolling-median-3m+calendar-cadence-v2.
| Observation | Index points |
|---|---|
| 2025-10 | 1464.00 |
| 2025-11 | 1464.00 |
| 2025-12 | 1480.00 |
| 2026-01 | 1510.00 |
| 2026-02 | 1601.00 |
| 2026-03 | 1602.00 |
| 2026-04 | 1615.00 |
| 2026-05 | 1615.00 |
| 2026-06 | 1641.00 |
| 2026-07 | 1641.00 |
| 2026-08 | 1641.00 |
| 2026-09 | 1704.00 |
EUR spend slice
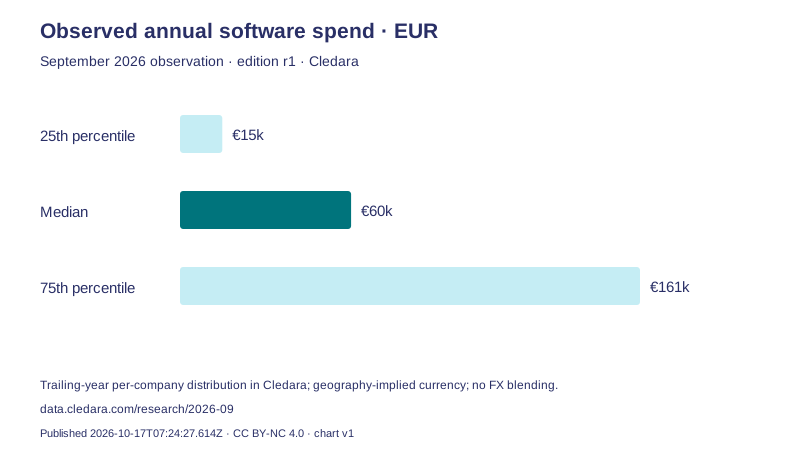
| Statistic | Amount |
|---|---|
| 25th percentile | €15k |
| Median | €60k |
| 75th percentile | €161k |
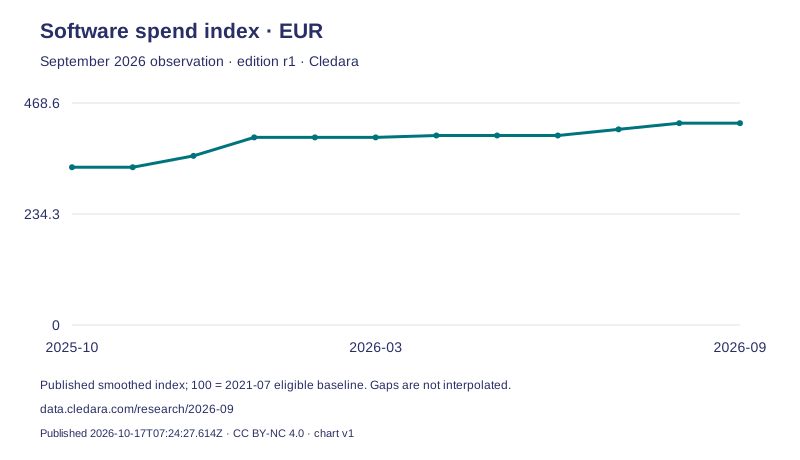
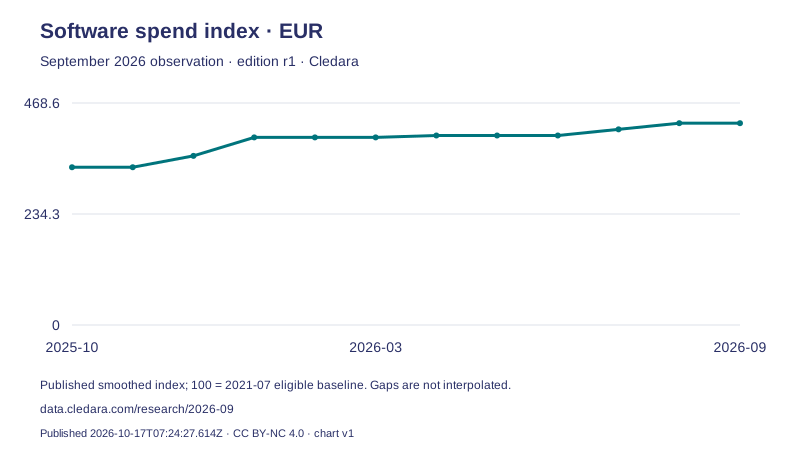
Index baseline: 2021-07; 100 represents the recorded eligible baseline. Gaps are not interpolated. Methodology fingerprint: 2026-10-known-buyers+usable-spend+coverage-90pct+rolling-median-3m+calendar-cadence-v2.
| Observation | Index points |
|---|---|
| 2025-10 | 333.00 |
| 2025-11 | 333.00 |
| 2025-12 | 357.00 |
| 2026-01 | 396.00 |
| 2026-02 | 396.00 |
| 2026-03 | 396.00 |
| 2026-04 | 400.00 |
| 2026-05 | 400.00 |
| 2026-06 | 400.00 |
| 2026-07 | 413.00 |
| 2026-08 | 426.00 |
| 2026-09 | 426.00 |
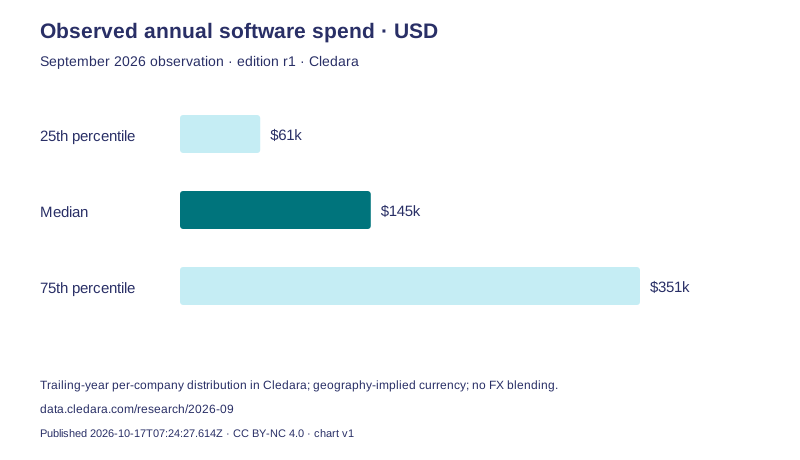
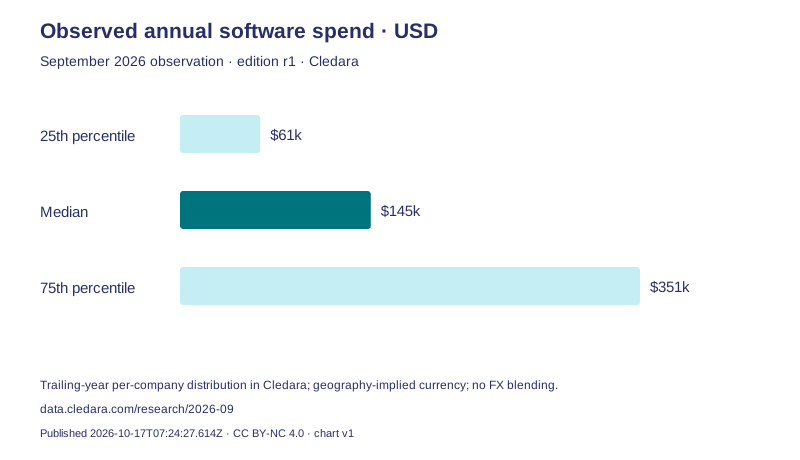
USD spend slice
| Statistic | Amount |
|---|---|
| 25th percentile | $61k |
| Median | $145k |
| 75th percentile | $351k |
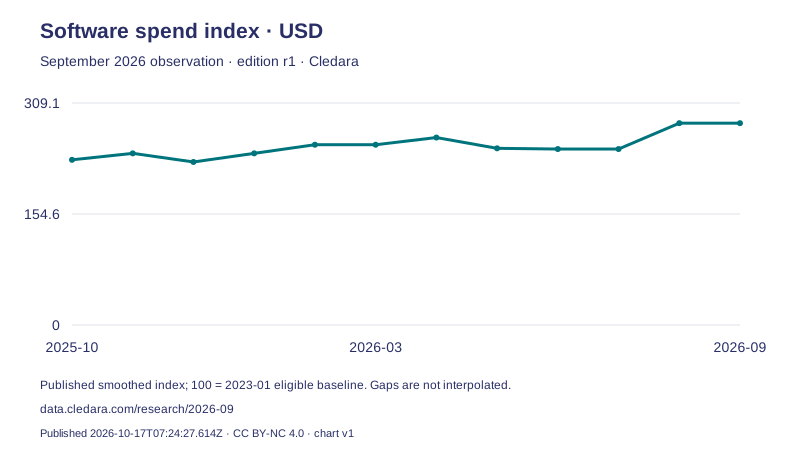
Index baseline: 2023-01; 100 represents the recorded eligible baseline. Gaps are not interpolated. Methodology fingerprint: 2026-10-known-buyers+usable-spend+coverage-90pct+rolling-median-3m+calendar-cadence-v2.
| Observation | Index points |
|---|---|
| 2025-10 | 230.00 |
| 2025-11 | 239.00 |
| 2025-12 | 227.00 |
| 2026-01 | 239.00 |
| 2026-02 | 251.00 |
| 2026-03 | 251.00 |
| 2026-04 | 261.00 |
| 2026-05 | 246.00 |
| 2026-06 | 245.00 |
| 2026-07 | 245.00 |
| 2026-08 | 281.00 |
| 2026-09 | 281.00 |
Source publications and reproducibility
Methodology: monthly-research-v1. These definitions and source identifiers were recorded with this edition. The source pages below can subsequently change; keep this edition URL and its data download when citing the report.
- Software market research. Source prepared ; source publication date . Publication identifier:
d33e3eedbfd0a5276f71d711fb9020d8fae2f57bd81488d98cf5a2e5932b395e. - Spend benchmarks. Source prepared ; source publication date . Publication identifier:
88c12e4e721e9672e794c3b387a4a54c959a9a7e9e096e1fed6c329d9bcf3324.
Monthly shares describe their named observations. Activity ranks and annual spend use trailing-year windows. Each download row identifies its unit, definition and exact period start/end; these different windows should not be combined as a single measure.
Reports require validated, matching complete-month observations from at least two metric families. These families use overlapping underlying Cledara payments and do not constitute independent samples. A changing cohort, enrichment or source revision can change observations without establishing a causal explanation.
Data and original charts are available without an email signup under CC BY-NC 4.0. Include Cledara, the observation month, edition identifier, source URL and selected metric when citing. For a possible error, contact the research correction team with the values and edition URL. Read the current general methodology.